
Demand Charges and Commercial Solar: Why Bill Savings Differ
Learn why solar can reduce purchased electricity without cutting demand charges by the same amount, and which bill records explain the difference.
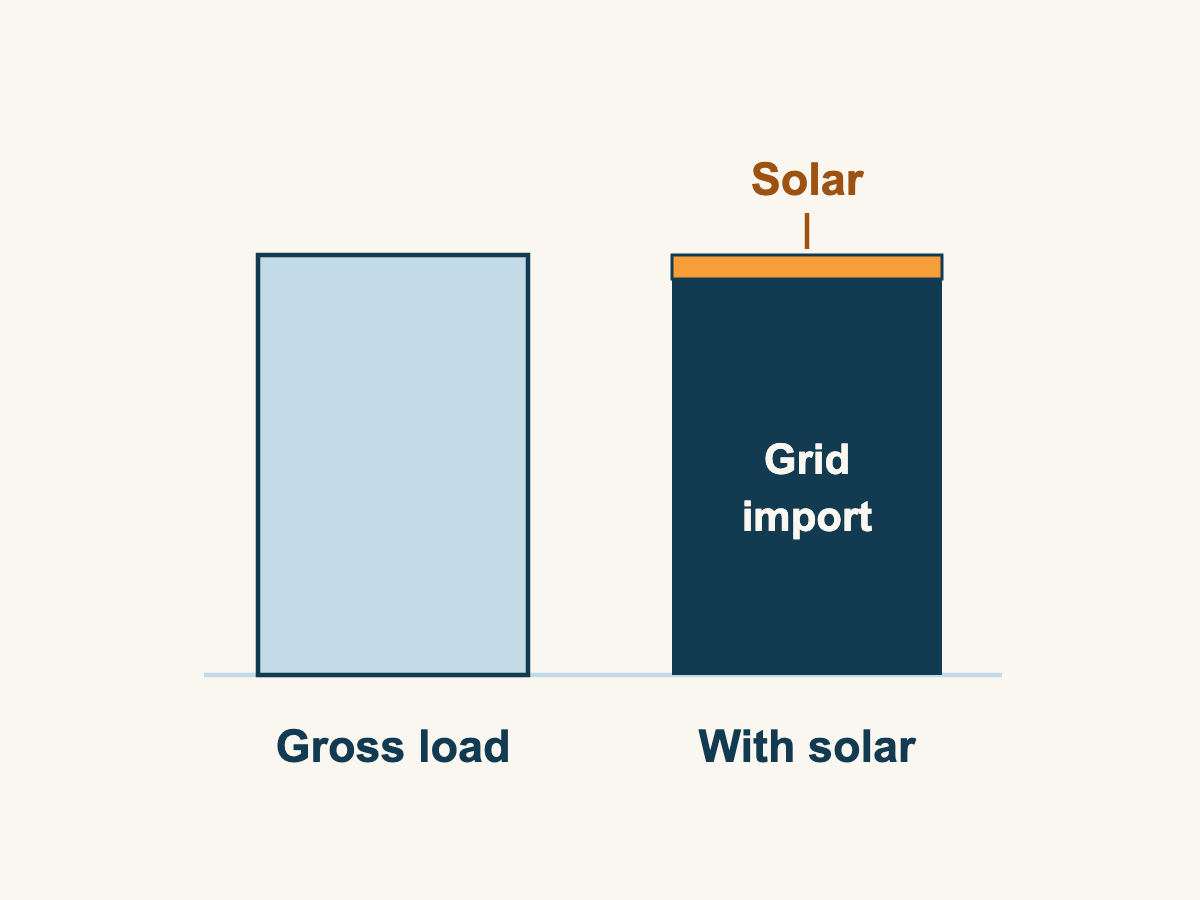
Conceptual load illustration, not a monthly demand calculation or a savings forecast.
Commercial solar can reduce the electricity a business buys without reducing its demand charges by the same proportion. Energy charges concern the amount purchased over time. Demand charges depend on how the tariff measures or calculates demand, which may reflect a short period of high use rather than the month's total consumption.
An annual solar-production estimate cannot answer both questions. To understand a proposed demand-charge reduction, an owner needs the account's rate schedule and a comparison of building use and solar output during the relevant billing intervals.
In this article
What is the difference between kWh and kW?
Kilowatt-hours, or kWh, measure energy used over time. Kilowatts, or kW, measure the rate of use. A demand charge applies the tariff's demand rules to the account, separately from charges based on purchased kWh.
For example, PECO's tariff generally measures the greatest 30-minute rate of use unless otherwise specified. Its General Service schedule also distinguishes measured demand from computed demand and includes minimums and a contract-demand provision. Those are PECO-specific rules, not a description of every account in PA, NJ or DE. See PECO's tariff, Rule 15 and Rate GS.
Why can demand-charge savings differ from energy savings?
The highest demand remaining after solar may occur when the array produces little. Reducing use during other hours still saves purchased energy, but it does not necessarily lower that remaining peak.
The peak can also move. An afternoon interval that was highest before solar may fall below a cloudy interval or an earlier operating shift after solar. Subtracting solar output only at the original peak can therefore overstate the reduction.
LBNL and NREL's commercial-solar research found that demand-charge savings varied with building loads, PV generation and rate design. That 2017 simulation explains why these factors matter; it is not a forecast for a particular business.
A hypothetical month, with the peak checked separately
The following inputs and prices are invented to demonstrate arithmetic. They are not utility rates, a Sundra quote or a savings forecast.
Assume the same building uses 60,000 kWh before and after solar. Solar supplies 18,000 kWh, all consumed on site, leaving 42,000 kWh to purchase. There is no storage or export.
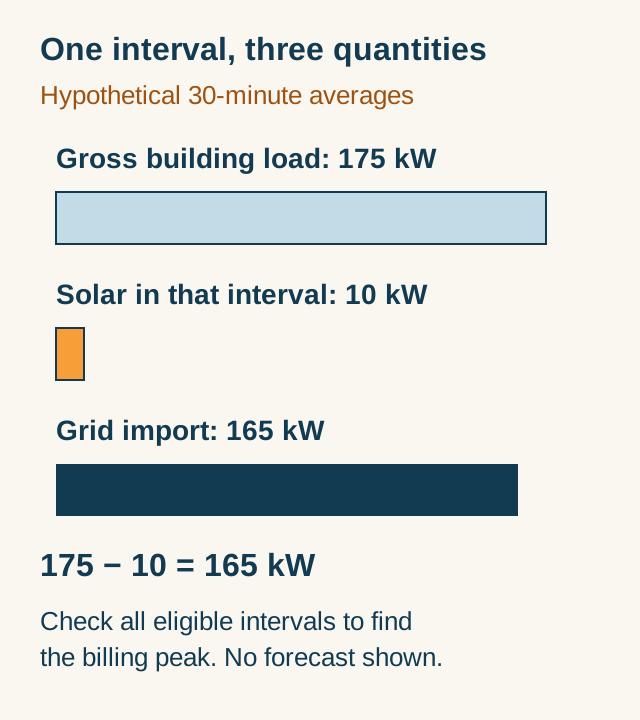
Without solar, the highest 30-minute average demand is 180 kW. After solar, the highest grid-import interval has a gross building load of 175 kW and average PV output of 10 kW during that same interval, leaving 165 kW imported. Assume every other post-solar interval imports no more than 165 kW. This example uses a basic monthly maximum with no minimum, ratchet or time restriction.
Hypothetical two-line subtotal using invented prices
| Item | Without solar | With solar |
|---|---|---|
| Purchased energy | 60,000 kWh | 42,000 kWh |
| Energy charge at an invented $0.09/kWh | $5,400 | $3,780 |
| Billing demand under the assumed rule | 180 kW | 165 kW |
| Demand charge at an invented $10/kW | $1,800 | $1,650 |
| Energy plus demand subtotal | $7,200 | $5,430 |
Purchased energy falls 30%, while demand falls about 8.3%. The two-line subtotal falls by $1,770, about 24.6%. Fixed charges, other delivery or supply charges and taxes are excluded, so this is not a complete bill.
The phrase gross building load matters. If 175 kW were already the meter's grid-import reading, subtracting the 10 kW of PV again would double-count solar. And if another interval imported 170 kW, that higher interval would set demand under this assumed rule.
Which tariff details can change the result?
A rate can restrict which hours count, apply a minimum or use a different basis for billing demand. Read the account's actual schedule before applying the simple example above.
In the rate designs examined by the LBNL/NREL study, a noncoincident charge uses a customer's peak without requiring it to occur during a predefined period. An on-peak charge restricts the eligible hours. A ratchet can carry earlier demand into the current billing calculation. These distinctions affect what reducing today's load can accomplish.
Net metering does not automatically remove demand charges. PECO's net-metering provisions retain applicable demand and other charges. The rate and any supply agreement need separate review; an export credit is not evidence that every bill component disappears.
What information supports a demand-charge savings estimate?
Gather the rate schedule, a full year of bills and available interval-use data. If a proposal includes demand-charge savings, ask how the estimate accounts for the highest net-import intervals after solar, not just annual generation or output at the old peak.
Check whether the calculation includes tariff minimums or floors, planned operating changes and any assumed storage dispatch. If interval data is unavailable, the model should identify the substitute load profile and its limits.
Use the commercial solar ROI guide for the wider investment calculation. If storage is proposed, the battery guide explains why its operating objective needs separate treatment. Talk with Sundra about commercial solar using your bills, tariff and operating schedule as the starting point. That gives the conversation a basis in how your building uses electricity.
Demand charge FAQs
Does a larger array guarantee a lower demand charge?
Does a larger array guarantee a lower demand charge?
No. Additional generation may occur outside the intervals that determine billing demand. The remaining peak and the tariff's billing rules still need to be checked.
Can the monthly bill show when the peak happened?
Can the monthly bill show when the peak happened?
Some bills provide peak information, but a billed-demand figure alone does not show the full load pattern. Request the underlying interval data and an explanation of how the utility calculated billing demand.
Sources
- PECO Electric Service Tariff, Supplement 37, effective October 1, 2026. Rule 15, Rate GS and Rate RS-2 support the scoped billing examples.
- LBNL/NREL: Exploring Demand Charge Savings from Commercial Solar, 2017. Supports the effects of load shape, generation timing and demand-charge design. The worked example above is original hypothetical arithmetic.
Related reading
- Commercial Solar ROI in 2026: Comparing the Numbers in PA, NJ and DE
- Commercial Solar Battery Storage: Backup Power vs Everyday Operation